Most systems will tell you revenue. Revenue is the least interesting number in the building.
Job profit starts from what the customer actually paid and works down: parts at cost, technician pay at whatever the tech is actually paid, tax that was collected on behalf of the state, card fees, discounts given at the counter. What is left is what the shop kept.
Every share is expressed against the same denominator — the total the customer paid — so the percentages add up and can be compared between jobs. A job that lost money is shown as having lost money.
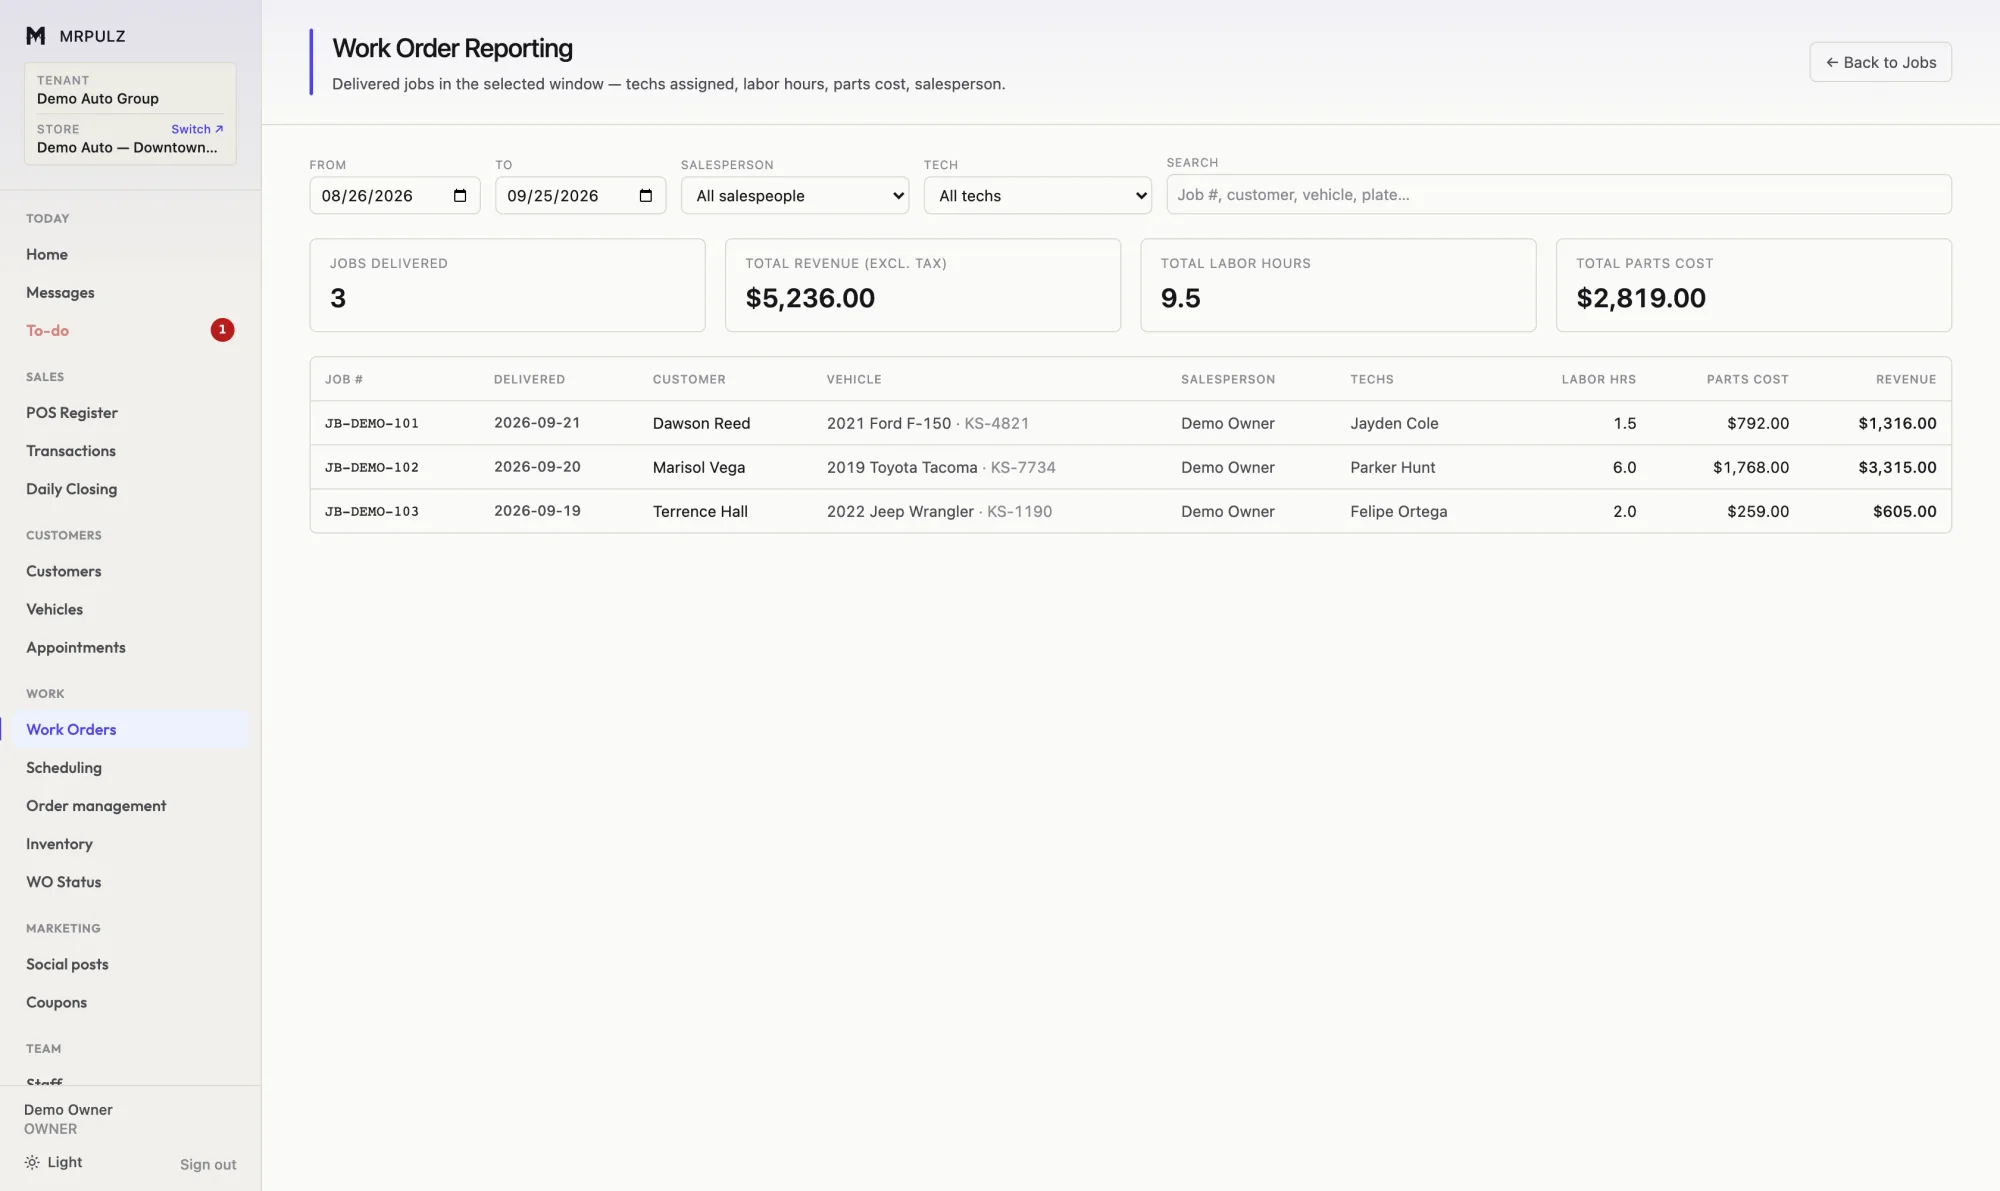
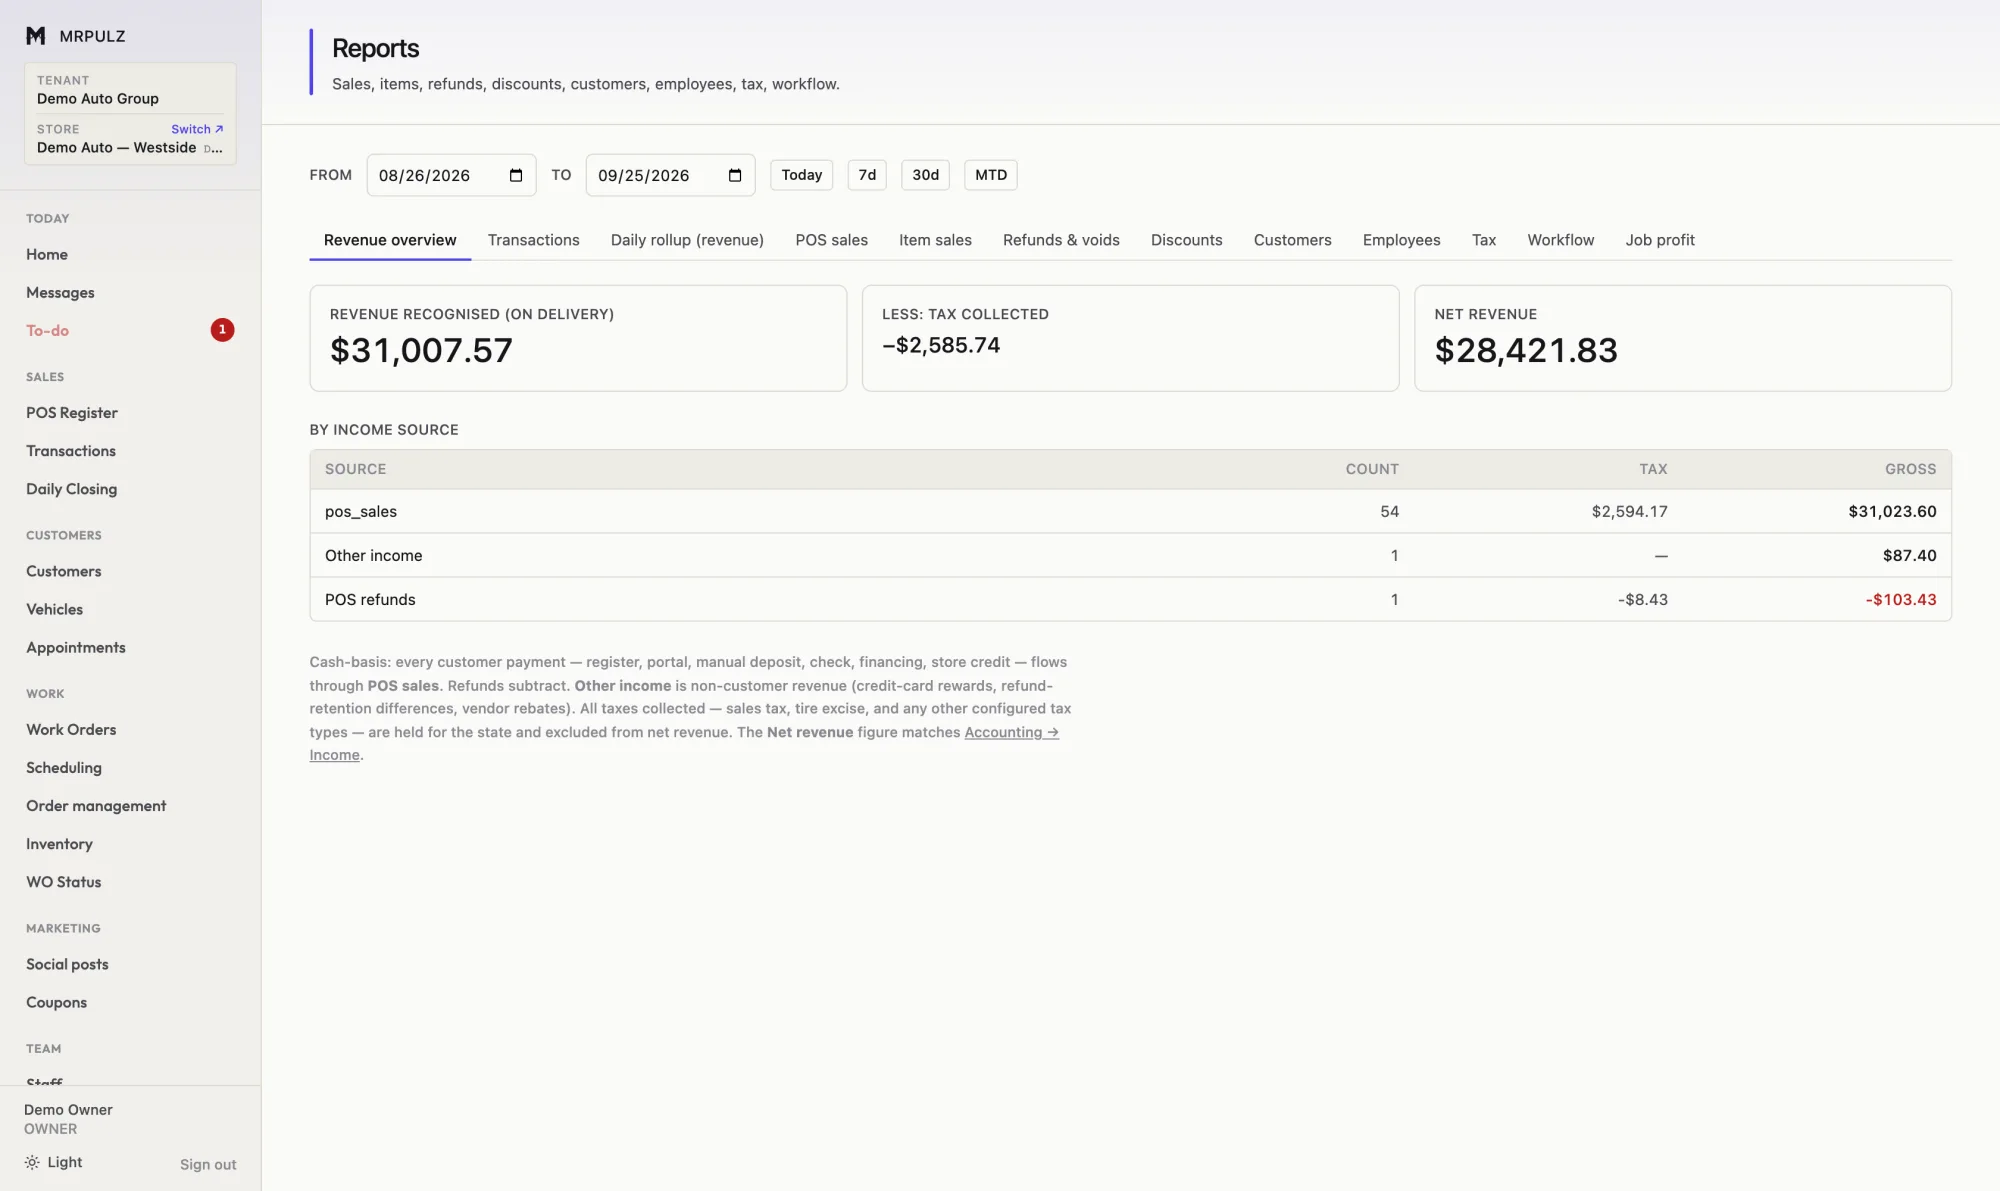
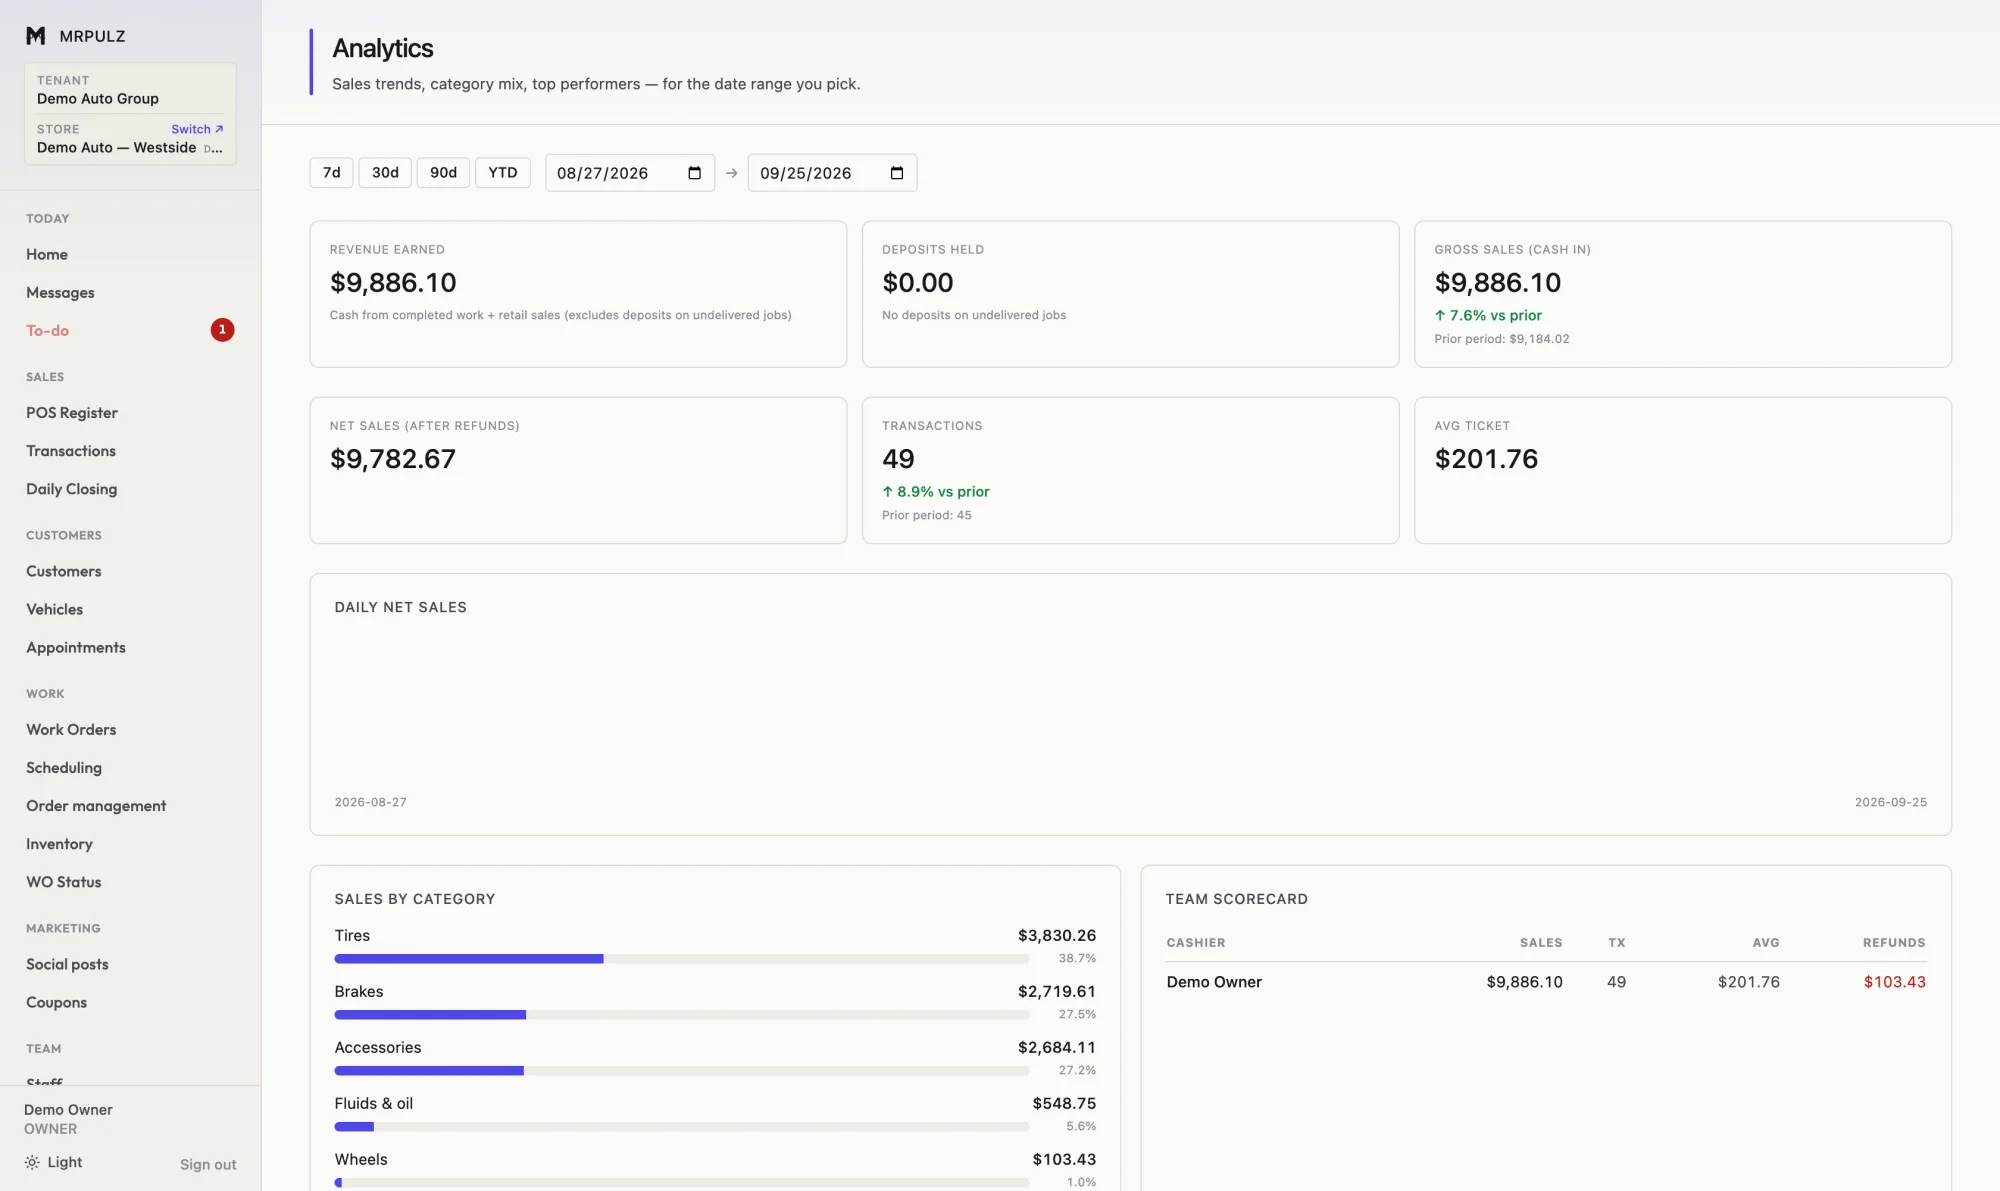
Beyond job profit: sales by item, by category and by customer; technician efficiency against flagged hours; days from approval to delivery; and a breakdown of where income came from.
Try it on your own work
Two weeks, everything switched on, no card. Put a real job through it and see whether the numbers come out the way you expect.
Start free